Debugging 101
Wesley is a Coding Architect at Xebia in Belgium, where he helps organizations to build better applications, helps teams to improve their skills and organizes workshops to share his knowledge. He's also a Microsoft Azure MVP, board member of the VISUG meetup in Belgium and speaker at conferences and meetups.
Welcome back for my second post about debugging! In this post, I'll give you an overview of the basic capabilities of the debugger in Visual Studio 2015, and add a few tips and tricks to take your debugging skills to the next level. We will not delve into the more advanced topics yet though, like debugging multi-threaded applications for example: those topics are being reserved for later posts (either by Maarten or myself) because they are too large to handle all at once.
Now, before you think to skip this post because you've been programming for some years, I do suggest to glance over this post: you might see something you didn't know, or didn't see the benefit of that debugger feature. If you already knew everything I've written in this post, then you are awesome! And should you know a neat trick which I didn't cover, then don't hesitate to leave a comment :)
Let's start with the basics, shall we?
Stop! Hammer Time!
When you debug code to find out where exactly things are going wrong, you'll probably have an idea where to start searching in the code base:
- You just wrote some new classes/methods and things started behaving not quite as expected.
- A unit test fails suddenly.
- An exception has been thrown and you can see where it originates using the stack trace.
So, you have an idea where to start digging. The obvious thing to do then, is to tell the debugger to stop running the code at that point in the source. This is a breakpoint, which you can set using the Debug > Toggle Breakpoint menu item or its default shortcut key F9. Visual Studio, and many other IDE's, typically indicates a breakpoint with a red circle in front of the line of code, optionally also changing the colorization of the code:

When we run this code, Visual Studio will stop executing the application right before executing the line of code were we added the breakpoint. You will also see a yellow arrow pointing at that line. Think of the yellow arrow as the instruction pointer (or program counter) for your code:

At this moment, you can start inspecting your application state using the different windows provided by Visual Studio. These are the first few views which can be useful when debugging, and all of these can be found in the menu Debug > Windows while the debugger is active:
- Watch: you can have four different watch views. These views allow you to inspect variables, fields, properties, collections, methods, and so on. You'll see the value and the data type listed next to the watch entry.
- Autos: this is a special watch window, showing the result of the current and previous lines of code if it can.
- Locals: this is also a special watch window, displaying all variables and method parameters in the current method or lambda expression. However, it doesn't show properties or fields who are being referenced in that method or lambda expression.
- Call Stack: this window shows the execution path up until now per executed method. Because not all of the code is managed code (written using the .NET CLR), or when you are missing debug symbols, you'll see some entries appearing as [External Code]: this can either be a 3rd party library you're using but Visual Studio couldn't find the (correct) debug symbols or PDB files for that library, or it could be unmanaged code - things Windows needs to do to start your .NET application, creating an AppDomain for instance. We'll cover the Call Stack window later in this post more in depth.
In this code example, you've obviously already seen what will go wrong: as awesome a number 42 might be, dividing it by zero just doesn't work in this universe. Before evaluating the next line of code however, you can inspect what would happen by adding value / 0 in the Watch 1 window, either by selecting the statement, right-clicking it and select the Add Watch menu item, or by pasting/typing the statement in a row in the Watch window:
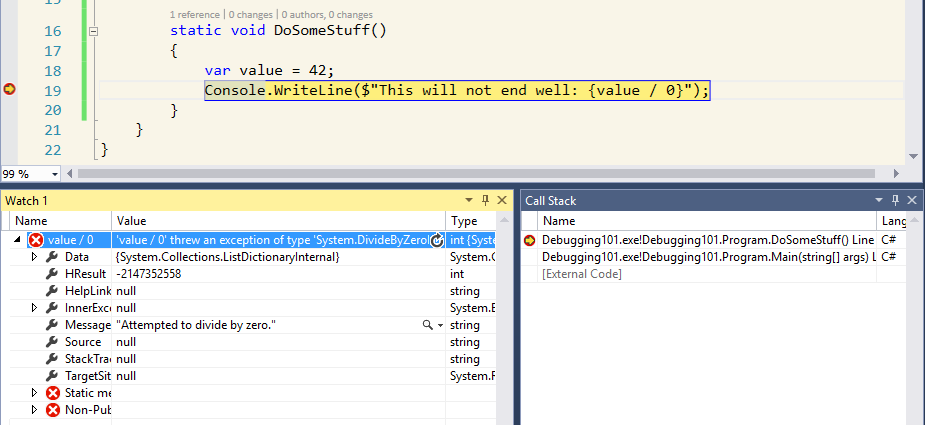
You can now stop the debugger (Debug > Stop Debugging, SHIFT+F5 or the Stop Debugging button in the toolbar) to fix the bad code, or you can even change it while the debugger is active:
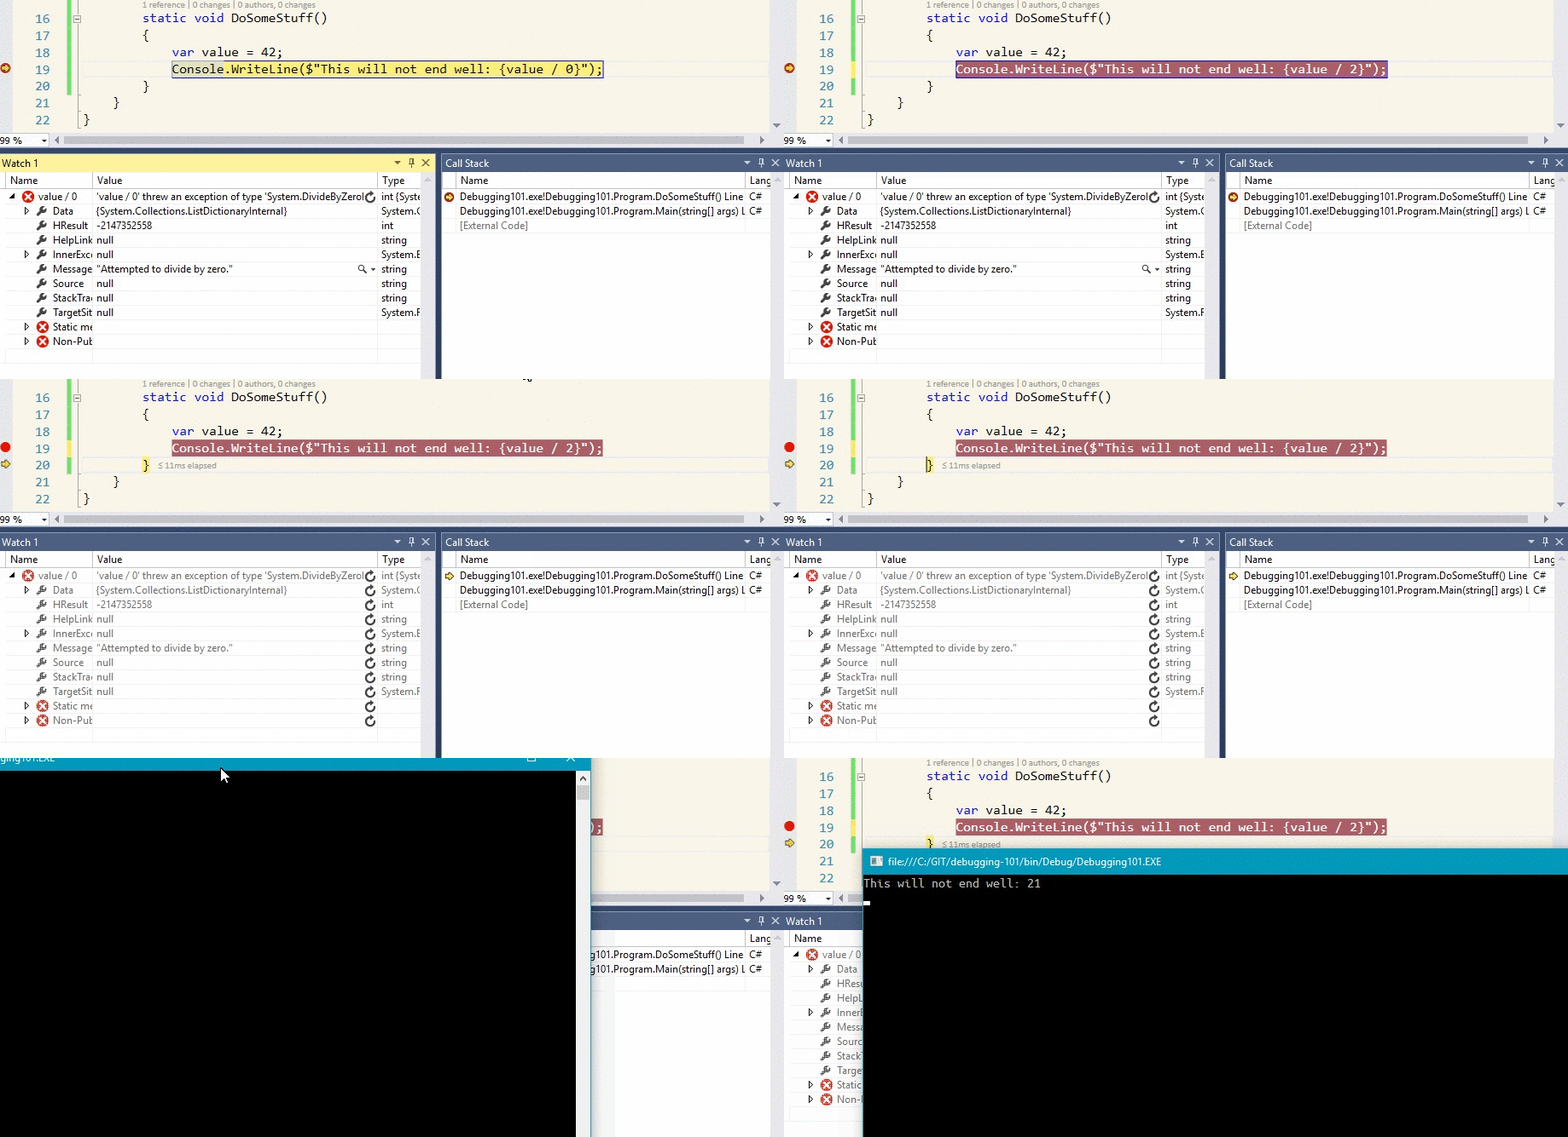
Stop! When it's hammer time!
This is, however, the absolute basics of debugging. We can do better than this! One improvement lies in controlling when the debugger actually decides to stop when it arrives at a breakpoint. You can disable any breakpoint, without removing it, by hovering over it and pressing the disable button. Other options are to right-click and select Disable Breakpoint or to press the default shortcut Ctrl+F9. This is an easy way of controlling a method where the application passes through several times, but where you don't want to stop continuously. But it's not ideal, and we have better tools in our toolbox.
A second tool, is to enable breakpoint conditions. Breakpoint conditions allows us to only break when certain things are true:
- When value equals 42, this is a conditional expression.
- When we hit this breakpoint for the n-th time, this is a hit count expression.
- When we run this code on a certain machine, in a certain process or thread: a filter.
To get to these options, you can hover over the breakpoint and click the cog wheel icon (labeled Settings...) or right-click and select the Conditions... menu item.
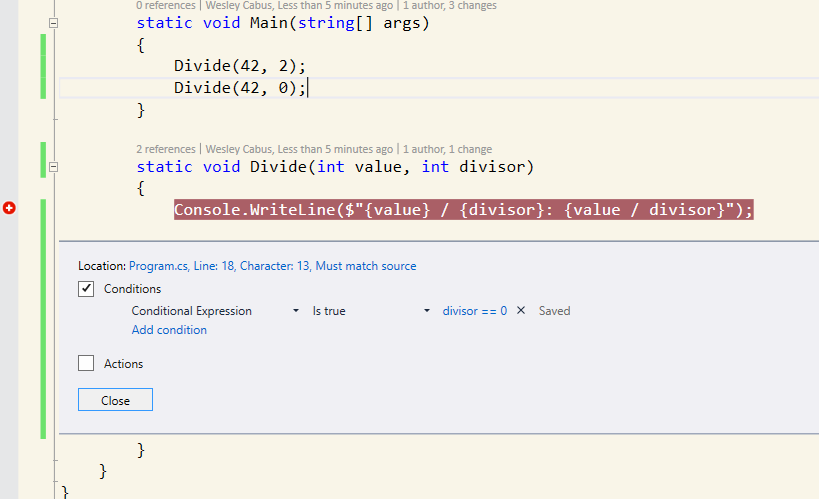
Visual Studio will now only stop running our application when the value of divisor equals 0. Neat!
As you can see in the image above, we can also add Actions to a breakpoint: for example, to log information to the Output window every time we pass the breakpoint. Ironically, this is how I used to debug when I started out coding: putting PRINT statements all over the place, displaying the values of variables to know what was going on.
Stop! HammerNotFoundException!
Another nifty trick to know, especially when having to fix a hot issue in an unknown code base, is by setting breakpoints on (un)handled exceptions. In the example I've been using, I can declare - inside Visual Studio - that I want the debugger to break whenever the DivideByZeroException is being thrown for example, even if this exceptions has been caught in the code. This enables you to stop executing the application when an exception arises, instead of when it might get rethrown in a main thread. You can reach these awesome bits in the Exception Settings window, through the Debug > Windows > Exception Settings menu item or its default shortcut CTRL+ALT+E:
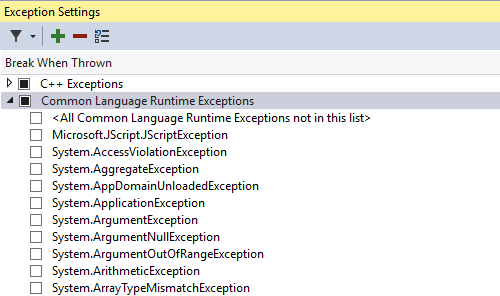
By default, you can choose to break on all unlisted exceptions, to break on your own exception types or those used by 3rd party libraries. That possibility is immediately followed by an extensive list of default exception types provided in the CLR, like the well-known System.NullReferenceException. You can also add specific missing exception types, by selecting the line Common Language Runtime Exceptions and hitting the Add button (indicated with the plus sign). When you right-click on an exception, you can choose an additional option: Continue when unhandled in user code. When you activate this, the debugger will not stop on that exception in your codebase if the exception is handled by the consumer of your code.
The Call Stack
I did promise a bit about the Call Stack window, didn't I? Well, here goes! Whenever the debugger stops running your application, the Call Stack window will show you the list of actions/methods/etc. that led up to the current point of execution:

Now, the [External Code] section is where things could get interesting. Basically, this is anything that is not in your code base, like native Windows API's, .NET CLR stuff, 3rd party libraries: you name it. You can however opt in to see what's behind the covers, by right clicking in the Call Stack window and enabling the option called Show External Code:
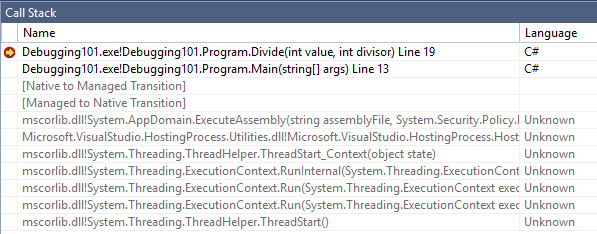
When you double click on an entry shown in black in the Call Stack (or right click and choose Switch to Frame), you can jump back and forth through the Call Stack, inspecting the flow of your application up to where it was interrupted by - for example - a breakpoint, including the state of each frame. This means that you can inspect all variables and fields for each step in the Call Stack, which can give you a lot more insight when trying to pinpoint where things might've gone wrong:
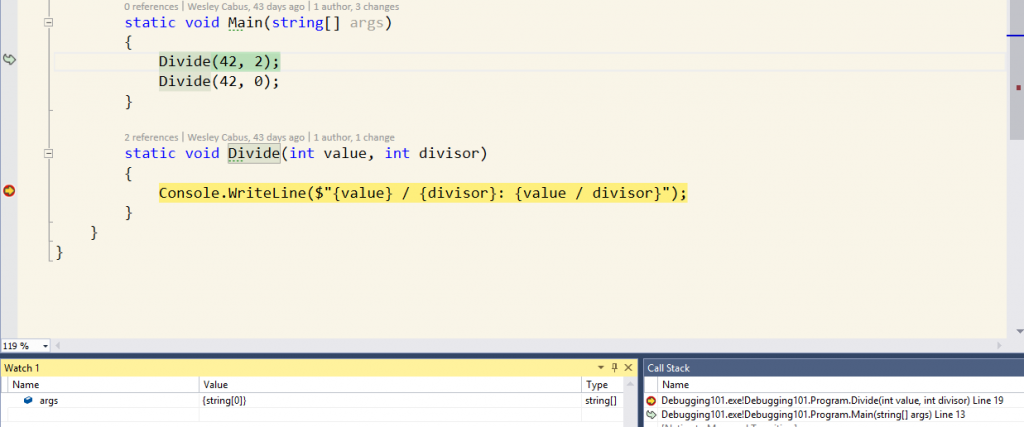
Now, you can also try to do this for code outside your code base, displayed as gray entries. Try clicking on a gray line in the Call Stack, and you'll be presented a window looking somewhat like this, depending on your settings:
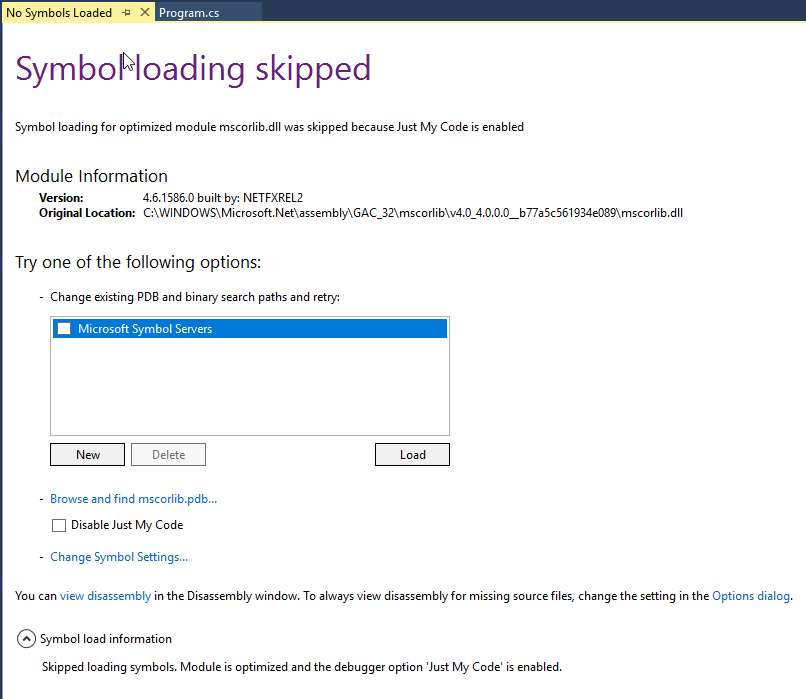
Basically, Visual Studio is telling you that it can't display any source code for the frame you've selected to inspect, but it can try to load debug symbols (or PDB files) which will help in showing some degree of information. As a last resort, you can try to click the View disassembly link, which will show you what's going on at the most basic of levels. You can, of course, add your own symbol servers. This can be convenient when you have a custom package feed with its own debug symbol source, or when you want to build debug symbols on the fly using DotPeek for example. Check out these two links to learn more about these possibilities, they will definitely help you when dealing with strange behavior in 3rd party libraries!
There are much more features hidden inside the Debug menu, but I'm going to save these for another post, where we will dive into more advanced concepts. Stay tuned!

